DriverReach’s Recruiting Manager Report is an invaluable resource for trucking companies, providing accurate data about the recruitment process in general and the performance of recruiting team members specifically. This robust report calculates statistics about the work accomplished within the DriverReach system by those users who have been assigned the role of recruiter, quantifying recruitment success by revealing areas where recruiters are meeting or exceeding expectations as well as areas requiring improvement during any specified date range. DriverReach users who wish to make the most of this powerful resource are in the right place–read on!
Navigate to the Report
Step 1
From any page within the DriverReach system, select “Reports” from the main navigation menu at the top of the page.

Step 2
Select the “Recruiting Manager Report” from the list on the “Reports” landing page.

Determine Report Parameters
Date Filter
The Recruiting Manager Report is run based on a specified date range input by the user using the date field located in the upper right corner of the report screen. After clicking anywhere within the date field, users may select the start date on the calendar that drops down to the left and the end date on the calendar that drops down to the right, ensuring that the report will only pull data from that specific time period.

Users must also decide how they would like to filter the results for the report they wish to run by using the drop-down menu located at the top right side of the Recruiting Manager Report table. Two filters, “Application Date” and “Processed Date”, are available; remember that to the right of this drop-down menu, users will find the date range input field, also marked below.
The “Application Date” option narrows report results down to those records that contain an application that was received within the specified date range. The “Processed Date” option narrows report results down to records wherein someone with a recruiter role changed the applicant’s stage (stages include “Active Prospect”, “Disqualified”, “No Current Interest”, “Hired”, as well as any custom levels DriverReach users have added to the system) at some point within the date range specified.

Users may choose to customize how the report is viewed by clicking on the top of a column header to organize data by that metric. Users may choose to view the table organized by that metric in either ascending order or descending order. Click once to switch the order of the data from descending to ascending, and click it again to switch it back. To organize the report data by a different metric, simply click on a different column header.

Data Points
The Recruiting Manager Report contains many useful data points that provide insight into the recruitment process; read on to explore them in more detail with examples of how the data is tabulated within the report.
Recruiters
This column of the report lists the individual names of users who have been assigned the role of recruiter within the DriverReach system for the specified date range. Click on the name of a recruiter from the far left column to drill down into specific information about that recruiter’s assignees within the DriverReach system.

As seen in the image below, the view after clicking on a recruiter’s name within the Recruiter Management Report includes the status, days in process, time to first contact, days to start process, and messages sent for each individual assigned to that recruiter during the date range and filter specified.

Applications Received
This column of the report lists the number of incoming applications received by each recruiter in the list for the specified date range.

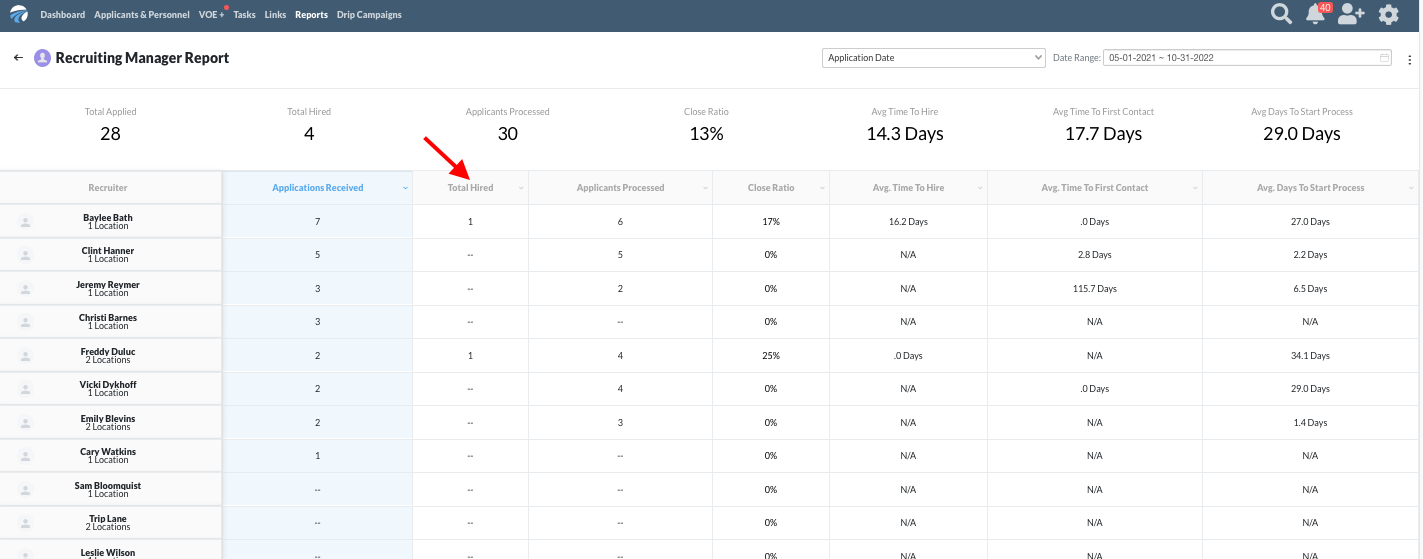
Total Hired
This column of the report shows the total number of applicants hired for each recruiter in the list within the specified date range.
Applicants Processed
This column of the report shows the total number of applicants processed for each recruiter in the list within the specified date range.

Close Ratio
This column of the report details the ratio of applicants who actually make it to the “Hired” stage. This is calculated by taking the total number of applicants hired, dividing it by the total number of applicants processed, and multiplying that result by 100. A processed stage is defined as any stage other than “Prospect”: “Hired”, “No Current Interest”, “Disqualified”, or “Terminated”.
For example, let’s say that our report for March 18 - March 31 pulls data for ten applicants in one of the processed stages and, of those, 5 were hired, the close ratio would be 5/10 x 100 = 50%, meaning 50% of processed applicants, or every 1 in 2 processed applicants, “close” (i.e. 1 in 2 applicants made it to the “Hired”, “No Current Interest”, “Disqualified”, or “Terminated” stage).

Average Time to Hire
This column of the report details the average time it takes to hire an applicant after his or her record is first entered as a prospect into the DriverReach system. This is calculated by taking the time stamp at which an applicant is marked as “Hired” in the DriveReach system and subtracting the timestamp at which the applicant was first given the “Prospect” status in the system, then adding that information for each applicant in the specified date range. This number is then divided by the total number of applicants that have been given the status of “Hired” in the specified date range.
For example, let’s say that our report for March 18 - March 31 pulls data for two applicants. The first was hired on March 26 at midnight and had first entered the system in an active prospect stage on March 19 at midnight; subtracting those dates leaves us with 7 days. The second was hired on March 31 at midnight and had entered the system on March 23 at midnight; subtracting those dates leaves us with 8 days. Keeping in mind that there are two applicants total, 7 days + 8 days = 15 days. We must divide 15 by 2, leaving us with 7.5 days as our average time to hire.

Average Time to First Contact
This column of the report calculates the average time it takes from the time the applicant is moved into an “Active Prospect” stage until the moment an organization first reaches out to a recipient via email or text within the DriverReach system. This is done by taking the timestamp when the initial email or text communication to an individual was sent (NOT when it was answered by the recipient, but only when it was sent through the DriverReach system) and subtracting from it the timestamp when the record entered a prospect stage within the DriverReach system. Each of these totals is added together for each individual within the specified time frame of the report, and then that total number is divided by the number of individuals who have been moved to a prospect stage within the specified time period.
For example, let’s say that our report for March 18 - March 31 pulls data for two applicants. The first was moved to a prospect stage at 1:00pm March 19 and the first communication sent to the applicant occurred at 1:00pm March 30; subtracting those dates leaves us with 11 days. The second became an active prospect at 8:00am March 23 with a text message sent at 8:00am March 25–subtracting those days leaves us with 2 days. Keeping in mind that we have two applicants total during the specified time period, 11 days + 2 days = 13 days. We must divide 13 by 2, leaving us with 6.5 days as our average time to first contact.

Average Days to Start Process
This column of the report calculates the average time it takes for an individual at the initial Active Prospect (typically “Active Prospect-New”) stage to move to any other stage or stage level, which is often another customer prospect stage but could also be “No Current Interest” or “Disqualified”. This is done by taking the timestamp when that individual is moved to the first “Prospect” stage in the DriverReach system and subtracting it from the timestamp of the next stage that individual is moved to. Each of these totals is added together for each individual within the specified time frame of the report, and then that total number is divided by the number of individuals who have been moved to the initial prospect stage within the specified time period.
For example, let’s say that our report for March 18 - March 31 pulls data for four prospects. The first individual was moved to the first prospect stage at noon March 20 with the change to another stage at noon March 28–subtracting those dates leaves us with 8 days. The second individual was moved to the first prospect stage at 9am March 22 with the change to another stage at 9am March 24; subtracting those dates leaves us with 2 days. The third individual was moved to the first prospect stage at 11pm March 27 with the change to the stage at 11pm March 28–subtracting those dates leaves us with 1 day. The fourth individual was moved to the first prospect stage at 6pm March 19 with the change to the stage at 6pm March 24–subtracting those dates leaves us with 5 days. Keeping in mind that we have four prospects total during the specified time period, 8 days + 2 days + 1 day +5 days = 16 days. We must divide 16 days by 4, leaving us with 4 days as our average days to start process.

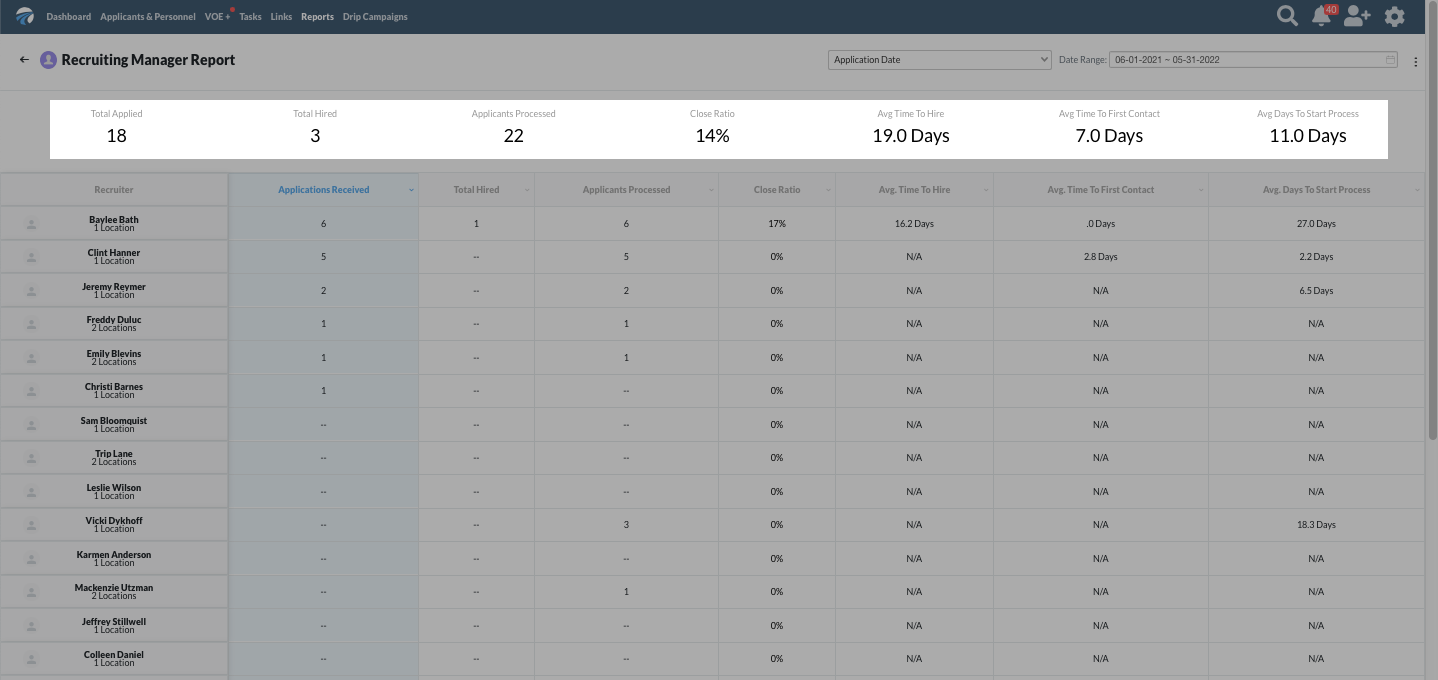
Data Summary
Across the top of the Recruiting Manager Report, the data summary (highlighted in the image below) provides aggregate detail of the entire recruiting team’s performance for the specified report filters–it basically takes all of the data from the table of individual recruiter statistics and compiles a general snapshot of those statistics combined. The sections of this portion of the Recruiting Manager Report are detailed below.
Total Applied
“Total Applied” provides a count of all incoming applications within the specified date range that have been assigned to a recruiter based on the selected filters.
Total Hired
“Total Hired” provides a count of all applicants who were assigned the stage “Hired” within the filters and parameters applied.
Applicants Processed
“Applicants Processed” provides a count of all individuals who have any stage other than one of the “Active Prospect” stages assigned within the specified date range--these stages include “Hired”, “No Current Interest”, “Disqualified”, or “Terminated”, as well as other custom stages a company may have implemented.
Close Ratio
This statistic is calculated the same way the recruiter-specific statistic is calculated in the report table, but of course it is an aggregate calculation including all individuals assigned to all recruiters within the dates specified. To learn more about this calculation, see the Close Ratio section for a detailed explanation.
Average Time to Hire
This statistic is calculated the same way the recruiter-specific “Average Time to Hire” statistic is calculated in the report table, but of course it is an aggregate calculation including all individuals assigned to all recruiters within the dates specified. To learn more about this calculation, see the Average Time to Hire section for a detailed explanation.
Average Time to First Contact
This statistic is calculated the same way the recruiter-specific “Average Time to First Contact” statistic is calculated in the report table, but of course it is an aggregate calculation including all individuals assigned to all recruiters within the dates specified. To learn more about this calculation, see the Average Time to First Contact section for a detailed explanation.
Average Days to Start Process
This statistic is calculated the same way the recruiter-specific “Average Days to Start Process” statistic is calculated in the report table, but of course it is an aggregate calculation including all individuals assigned to all recruiters within the dates specified. To learn more about this calculation, see the Average Days to Start Process section for a detailed explanation.